The ScriptGrain Writing Index, Q4 2026: 161 company homepages, measured every quarter
SGR-025, conducted 2026-11-03. Analyst: Jack Stovell, founder, ScriptGrain.
Question: What does the first quarterly reading of The ScriptGrain Writing Index, a fixed panel of 161 company homepages measured since 2000, show for the fourth quarter of 2026, and did the writing on those homepages change since mid-2026?
Summary
Background. SGR-004 measured 161 long-lived company homepages once a year from 2000 to 2026. A single study ages; a panel that is measured again on a fixed schedule with fixed definitions does not. This is the first refresh, and the first release of the dataset under the name The ScriptGrain Writing Index, with a version number, stable column names and a changelog.
What we did. We fixed the Index definition in public before the new measurement: six headline measures (no composite score), the statistic for each, and a threshold for calling a quarter-on-quarter move a change, taken from the largest whole-year move in SGR-004's own published data. Then we fetched each company's current homepage once on 11 October 2026 and measured it exactly as SGR-004 measured its pages (same extractor, same product instruments, same word lists). The 2026 Q4 reading is compared with each company's own mid-2026 reading (a Wayback Machine capture from 5 June 2026 to 11 July 2026), using only the 105 companies measured both times.
What we found. 149 of 161 homepages had enough prose to measure in 2026 Q4. Across the 105 matched companies, 4 of 6 measures showed no detectable change, 1 moved by less than the pre-registered threshold and 1 changed (words of prose on the homepage, up). We expected little change over about four months, and the pre-registration said so; what the table shows is how far the two readings differ, not proof that any company rewrote its page.
What it means. This is the Index's baseline reading, not a trend. One quarter cannot show direction, and the first comparison also changes the way pages are obtained (an archive replay in mid-2026, a live fetch now), so even a measure marked as changed should be read as 'the two readings differ'. The value of the Index builds with each quarterly refresh.
Key numbers
- 149 of 161 company homepages had enough prose to measure in the fourth quarter of 2026 (ScriptGrain Writing Index v1.0.0; 107 in mid-2026).
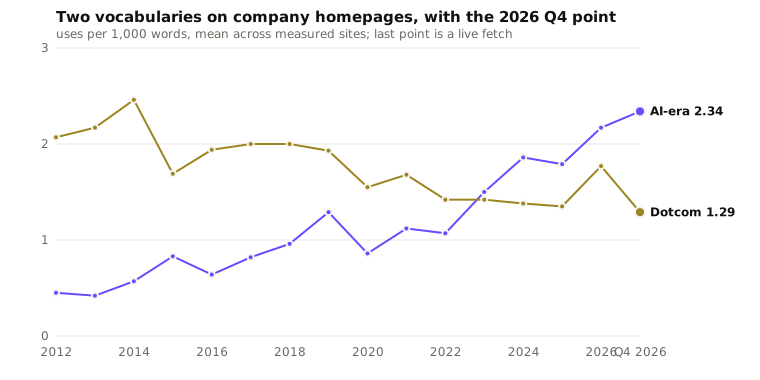
- AI-era marketing vocabulary averaged 2.34 uses per 1,000 words on company homepages in 2026 Q4, against 2.17 in mid-2026 (all measured sites in each period; comparing the 105 companies measured both times, the result was: no detectable change).
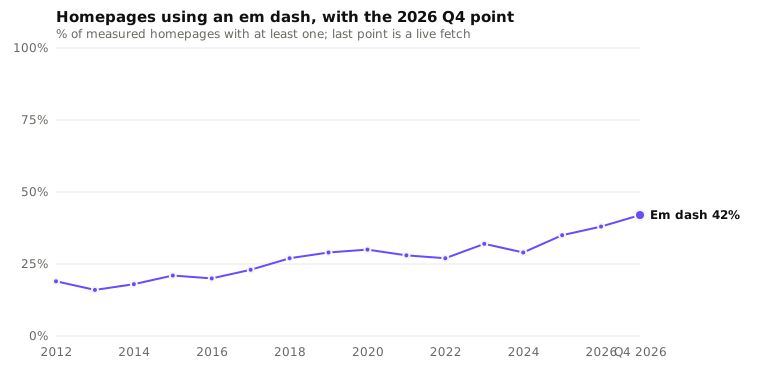
- 42% of measured company homepages used an em dash in 2026 Q4, against 38% in mid-2026.
- The median company homepage carried 639 words of prose in 2026 Q4 and 606 in mid-2026.
- Comparing each of 105 companies with itself, 4 of 6 headline measures showed no detectable change between mid-2026 and 2026 Q4.
Sample
The SGR-004 panel: 161 company homepages (UK and US, 11 sectors), fixed in October 2026. Period 2026 Q4: each homepage fetched once, live, on 11 October 2026, rendered with JavaScript. Baseline: the same companies' mid-2026 readings from SGR-004 (Wayback Machine captures, 5 June 2026 to 11 July 2026). 105 companies were measured in both.
- The homepage (the domain's root URL) only, never a deeper page
- At least 100 words of prose after menus, footers and scripts were removed, as in SGR-004
- Only companies measured in both periods enter the comparison
Method
Pre-registration: the Index definition, the six measures, the thresholds and the analysis were committed to ScriptGrain's research repository before the new pages were measured (docs/research/sgr-025-preregistration.md). The script was tested on 8 sites (5%); the test results are not reported.
Fetch: each homepage was requested once at https://domain/ through a page-rendering service with JavaScript run and caching off, on 11 October 2026. Sites the service refuses are recorded as fetch failed, not retried by other means.
Extraction and measurement: identical to SGR-004. Visible prose lines with scripts, navigation and footers removed (page headers, forms and asides kept; repeated lines counted once), measured with the product's own deterministic instruments, measureTextFeatures and scanCliches, and the two fixed word lists. No language model was used to read or score any page.
Comparison: for the 105 matched companies, the change in each headline measure from mid-2026 to 2026 Q4 with a 95% bootstrap interval (2,000 resamples of companies, fixed seed). A move is called a change only if the interval excludes zero and the move reaches the pre-registered threshold.
Checks: SGR-004's own 2026 captures of 8 sites were re-rendered and measured with this code to show it reproduces SGR-004's rows; 16 sites were requested a second time (15 returned a page) to show how much a repeat fetch of the same live page differs.
Variables measured
- Words of prose on the homepage
- Average sentence length (words)
- AI-era vocabulary, style words only, per 1,000 words
- Dotcom corporate vocabulary per 1,000 words
- Share of homepages with at least one em dash
- ScriptGrain AI-tell density per 1,000 words
- Words, sentence shape, pronouns, contractions and punctuation (all columns in the dataset)
What each measure means
- The Index
- A fixed panel of 161 UK and US company homepages in 11 sectors, measured on six headline measures every period with fixed definitions. Version 1.0.0. Each refresh adds a period; a changed definition is a new major version with a changelog entry. There is no composite score, because the measures move in different directions and any weighting would be a choice that could be tuned.
- Words of prose on the homepage
- Column words. Level: median across measured sites. Change between periods: median of the site-by-site differences.
- Average sentence length (words)
- Column avg_sentence_length. Level: median across measured sites. Change between periods: median of the site-by-site differences.
- AI-era vocabulary, style words only, per 1,000 words
- Column ai_era_style_per1000. Level: mean across measured sites. Change between periods: mean of the site-by-site differences.
- Dotcom corporate vocabulary per 1,000 words
- Column dotcom_vocab_per1000. Level: mean across measured sites. Change between periods: mean of the site-by-site differences.
- Share of homepages with at least one em dash
- Column em_only_per1000. Level: share of measured sites with at least one. Change between periods: difference in the share, matched sites.
- ScriptGrain AI-tell density per 1,000 words
- Column ai_tell_per1000. Level: mean across measured sites. Change between periods: mean of the site-by-site differences.
- Matched sites
- Companies measured in both periods being compared. Only they enter a comparison, so a site joining or leaving the measured set cannot move it.
- Threshold
- The smallest move called a change. For each measure it is the largest whole-year move among matched sites between 2022 and 2026 in SGR-004's published data, fixed before the new pages were measured. A quarter-on-quarter move must be as big as that to be called a change.
- Three results
- No detectable change: the 95% interval for the move includes zero. Moved, below the threshold: the interval excludes zero but the move is smaller than the threshold. Changed: the interval excludes zero and the move is at least the threshold.
Findings
- Words of prose on the homepage: changed (617 in mid-2026, 651 in 2026 Q4 (+34 words, 95% interval 15 to 86)): Matched sites: 105. Threshold for a change: 33 words. Rule: the interval must exclude zero and the move must reach the threshold.
- Average sentence length (words): no detectable change (9.04 in mid-2026, 9.35 in 2026 Q4 (0.00, 95% interval −0.05 to 0.15)): Matched sites: 105. Threshold for a change: 0.07. Rule: the interval must exclude zero and the move must reach the threshold.
- AI-era vocabulary, style words only, per 1,000 words: no detectable change (2.21 in mid-2026, 2.16 in 2026 Q4 (−0.05, 95% interval −0.52 to 0.43)): Matched sites: 105. Threshold for a change: 0.52. Rule: the interval must exclude zero and the move must reach the threshold.
- Dotcom corporate vocabulary per 1,000 words: moved, below the threshold (1.69 in mid-2026, 1.22 in 2026 Q4 (−0.47, 95% interval −0.92 to −0.08)): Matched sites: 105. Threshold for a change: 0.59. Rule: the interval must exclude zero and the move must reach the threshold.
- Share of homepages with at least one em dash: no detectable change (38% in mid-2026, 43% in 2026 Q4 (+5 percentage points, 95% interval −3 to 12)): Matched sites: 105. Threshold for a change: 6 percentage points. Rule: the interval must exclude zero and the move must reach the threshold.
- ScriptGrain AI-tell density per 1,000 words: no detectable change (0.21 in mid-2026, 0.29 in 2026 Q4 (+0.08, 95% interval −0.05 to 0.23)): Matched sites: 105. Threshold for a change: 0.08. Rule: the interval must exclude zero and the move must reach the threshold.
- Coverage (149 of 161 homepages measured in 2026 Q4, 105 matched with mid-2026): A homepage with under 100 words of prose, a bot check page or a refused fetch is recorded, not measured.
- Instrument check (4 of 8 sites reproduced SGR-004's published row exactly): The others came back from the archive as a different page on re-rendering (an empty script shell, or content that loads differently), not as a different measurement of the same page.
What this study does not show
- That any homepage was written or changed with AI. The Index measures vocabulary and punctuation on public pages, not who or what wrote them.
- That a difference between mid-2026 and the fourth quarter is a change in the writing. The two readings are obtained differently (an archive replay and a live fetch), at different dates.
- A trend. One quarterly reading cannot show direction.
- That voice measurement, ScriptGrain's or anyone's, can tell whether a text was written by AI. Nothing in this study tests that.
- Anything about pages other than homepages, or about companies outside the panel.
Two vocabularies, with the 2026 Q4 point
Homepages using an em dash, with the 2026 Q4 point
Mid-2026 against 2026 Q4, matched companies
Each company is compared with itself. The threshold is the smallest move called a change; it was fixed before the new pages were measured. 4 of 6 measures showed no detectable change, 1 moved by less than the pre-registered threshold and 1 changed (words of prose on the homepage, up).
| Measure | Mid-2026 | 2026 Q4 | Move (95% interval) | Threshold | Result |
|---|---|---|---|---|---|
| Words of prose on the homepage | 617 | 651 | +34 words (15 to 86) | 33 words | Changed |
| Average sentence length (words) | 9.04 | 9.35 | 0.00 (−0.05 to 0.15) | 0.07 | No detectable change |
| AI-era vocabulary, style words only, per 1,000 words | 2.21 | 2.16 | −0.05 (−0.52 to 0.43) | 0.52 | No detectable change |
| Dotcom corporate vocabulary per 1,000 words | 1.69 | 1.22 | −0.47 (−0.92 to −0.08) | 0.59 | Moved, below the threshold |
| Share of homepages with at least one em dash | 38% | 43% | +5 percentage points (−3 to 12) | 6 percentage points | No detectable change |
| ScriptGrain AI-tell density per 1,000 words | 0.21 | 0.29 | +0.08 (−0.05 to 0.23) | 0.08 | No detectable change |
The Index by period
All measured homepages in each period: median words and sentence length, mean vocabulary and AI-tell density, share with an em dash. The last row is a live fetch; the others are Wayback captures nearest 1 July.
| Period | Measured | Median words | Median sentence length | AI-era per 1,000 | Dotcom per 1,000 | With an em dash | AI-tell per 1,000 |
|---|---|---|---|---|---|---|---|
| 2000 | 39 | 169 | 7.90 | 0.42 | 3.65 | 3% | 0.06 |
| 2001 | 54 | 192 | 8.22 | 0.49 | 3.18 | 7% | 0.02 |
| 2002 | 60 | 175 | 7.69 | 0.29 | 2.41 | 8% | 0.42 |
| 2003 | 63 | 235 | 7.84 | 0.24 | 3.28 | 5% | 0.43 |
| 2004 | 74 | 227 | 8.11 | 0.11 | 3.45 | 8% | 0.32 |
| 2005 | 82 | 209 | 8.09 | 0.14 | 2.62 | 10% | 0.75 |
| 2006 | 101 | 247 | 8.19 | 0.24 | 2.70 | 10% | 0.11 |
| 2007 | 103 | 245 | 8.03 | 0.58 | 2.07 | 9% | 0.18 |
| 2008 | 103 | 251 | 8.00 | 0.34 | 1.89 | 12% | 0.12 |
| 2009 | 117 | 287 | 7.79 | 0.24 | 1.61 | 10% | 0.11 |
| 2010 | 120 | 319 | 7.31 | 0.44 | 2.06 | 16% | 0.03 |
| 2011 | 122 | 343 | 7.58 | 0.32 | 2.34 | 18% | 0.31 |
| 2012 | 124 | 341 | 7.36 | 0.45 | 2.07 | 19% | 0.13 |
| 2013 | 124 | 379 | 7.73 | 0.42 | 2.17 | 16% | 0.12 |
| 2014 | 128 | 396 | 7.88 | 0.57 | 2.46 | 18% | 0.16 |
| 2015 | 136 | 393 | 8.09 | 0.83 | 1.69 | 21% | 0.13 |
| 2016 | 132 | 399 | 8.06 | 0.64 | 1.94 | 20% | 0.13 |
| 2017 | 126 | 377 | 8.55 | 0.82 | 2.00 | 23% | 0.28 |
| 2018 | 131 | 379 | 8.48 | 0.96 | 2.00 | 27% | 0.16 |
| 2019 | 133 | 428 | 8.83 | 1.29 | 1.93 | 29% | 0.19 |
| 2020 | 132 | 437 | 9.23 | 0.86 | 1.55 | 30% | 0.18 |
| 2021 | 136 | 417 | 9.20 | 1.12 | 1.68 | 28% | 0.15 |
| 2022 | 128 | 481 | 9.14 | 1.07 | 1.42 | 27% | 0.14 |
| 2023 | 129 | 522 | 8.80 | 1.50 | 1.42 | 32% | 0.05 |
| 2024 | 125 | 520 | 9.11 | 1.86 | 1.38 | 29% | 0.11 |
| 2025 | 121 | 576 | 9.53 | 1.79 | 1.35 | 35% | 0.17 |
| 2026 | 107 | 606 | 9.02 | 2.17 | 1.77 | 38% | 0.20 |
| 2026 Q4 | 149 | 639 | 8.79 | 2.34 | 1.29 | 42% | 0.31 |
By sector, 2026 Q4
| Sector | Homepages measured | Median words | AI-era per 1,000 | With an em dash |
|---|---|---|---|---|
| agencies services | 10 | 626 | 4.50 | 60% |
| consumer brands | 13 | 356 | 2.57 | 31% |
| finance | 18 | 731 | 3.18 | 22% |
| hardware electronics | 14 | 339 | 3.20 | 36% |
| insurance | 8 | 456 | 1.15 | 25% |
| logistics auto | 10 | 457 | 1.32 | 30% |
| retail | 21 | 801 | 0.40 | 29% |
| software | 27 | 656 | 3.73 | 74% |
| telecom media | 10 | 1,291 | 0.15 | 50% |
| travel | 10 | 601 | 2.97 | 40% |
| web saas marketing | 8 | 789 | 0.68 | 38% |
Checks
Instrument: SGR-004's own 2026 captures of 8 sites were re-rendered and measured with this study's code. 4 of 8 matched the published row on every column. The rest came back from the archive as a different page when re-rendered (some as an empty script shell on the first try), so they test the archive's stability, not the measurement.
Repeat fetch: 15 sites were fetched a second time shortly after the first. 14 were measured both times; the median absolute difference between the two fetches was 0 words, 0.00 words of sentence length, 0.00 AI-era uses per 1,000 words and 0.00 AI-tell density; 1 changed between having and not having an em dash. That is the size of difference a live page shows against itself, before any real change.
The Index: version and changelog
Version 1.0.0. The dataset keeps its column names across refreshes: a column is never renamed or repurposed, and a new one is added at the end and noted below. A changed measure, statistic or threshold is a new major version. The files at /research/scriptgrain-writing-index.csv and .json are replaced with each refresh and always carry every period.
| Version | Released | Period added | What changed |
|---|---|---|---|
| 1.0.0 | 4 November 2026 | 2026 Q4 | First release of the Index. Starts from the 2,950 measured homepage-years of SGR-004 (161 companies, 2000 to 2026, Wayback captures nearest 1 July) and adds one live fetch of each company's current homepage as period 2026-Q4. Fixes the six headline measures, their statistics and the thresholds for calling a quarter-on-quarter move a change. No composite score. Columns are those of the SGR-004 dataset plus index_version, period, collected, source and ai_era_style_per1000 (SGR-004 derived it in its analysis step; the Index stores it). |
Limitations
- The two readings are obtained differently: mid-2026 is a rendered Wayback Machine replay of a capture, the fourth quarter is a live fetch. A page can differ between an archive replay and the live site for reasons that have nothing to do with its copy (cookie banners, personalisation, scripts that no longer load, content that loads later). Any difference between the periods includes that.
- The two readings are about four months apart, so a small change is expected. The Index is built to be read over several quarters, not one.
- Homepages only, and a homepage is the most edited, most headline-shaped page a company has. The panel is 161 large, long-lived companies, mostly UK and US; small businesses and companies founded after 2010 are not represented.
- Vocabulary is not authorship. More 'unlock' and 'seamless' on a page is consistent with AI-assisted writing and with copywriters adopting words that AI made familiar. The Index cannot tell those apart and does not say which homepage was written by a model.
- Some companies could not be fetched live (the page-rendering service refuses certain sites), some serve a bot check, and some redirect to another domain; the measured set differs between periods, which is why comparisons use matched companies only.
- The thresholds come from SGR-004's own year-on-year moves among matched sites; they are a judgement about how large is large, fixed in advance, not a statistical property.
Competing interests
ScriptGrain sells writing-voice measurement and the analyst builds it. The Index definition, the thresholds and the rule for calling a change were committed to ScriptGrain's research repository (public on GitHub) before the new pages were measured, every measure is reported whichever way it came out, and the data and scripts are public.
Reproducing this
- Pre-registration, Index definition, run script and entry builder: docs/research/sgr-025-preregistration.md and scripts/experiments/sgr-025/ in ScriptGrain's research repository.
- Instruments: supabase/functions/_shared/voice-match.ts (measureTextFeatures) and ai-cliches.ts (scanCliches), the code the product runs. The fetched pages are not republished; every row carries its fetch date, so any page can be fetched and measured again.
Data
- The Index: every homepage, every period, stable columns (CSV) (csv)
- The Index: definition, columns, series by period, latest comparison and changelog (JSON) (json)
- This refresh: coverage, comparison and checks (JSON) (json)
Released under CC BY 4.0: free to reuse, including commercially, with credit to ScriptGrain and a link to this page.
Citations
- ScriptGrain (2026). Did ChatGPT change how companies write? 27 years of homepages, measured (SGR-004)
- Wayback Machine, Internet Archive
How to cite
ScriptGrain (2026). The ScriptGrain Writing Index, Q4 2026: 161 company homepages, measured every quarter (Index version 1.0.0; Study SGR-025, conducted 3 November 2026). Dataset licensed CC BY 4.0. https://scriptgrain.com/research/scriptgrain-writing-index
About the analyst
Jack Stovell has worked in finance and data for more than twelve years, building management reporting, forecasting and profitability models for advertising agencies and tech scale-ups, from SQL and Power BI reporting to board-level analysis. Since 2016 he has run Adapt Progress Evolve, an applied AI studio, where he builds and operates AI systems and data products: ScriptGrain's measurement of writing voice across 45 attributes, UK Spend, which brings 16.7 million rows of UK council spending into one queryable dataset, and more than thirty AI agents running in production. He designs ScriptGrain's studies and is accountable for every number in them.